Showing posts with label Section 1. Show all posts

Wednesday, 12 August 2015

1.9 describe the effects of forces between bodies such as changes in speed, shape or direction

FORCES WITH CHANGES OF SPEED:

- If an object accelerates, weight and the surface of what the object is on's reaction are in place, but also drag and thrust but as the object is accelerating the thrust overpowers drag and hence moves forward.
- A stationary object has weight and the surface of what the object is on's reaction - however these forces are equal and so are balanced.
- When an object moves a constant speed, weight, surface's reaction, thrust and drag are taking place but all forces are equal so the speed doesn't change.
- A decelerating object doesn't move on a Y axis as weight and the surface's reaction are equal but the object decelerates since drag overpowers thrust and thus slows it down.

FORCES WITH CHANGES OF SHAPES:

- The shape of an object effects momentum, using the formula force = change in momentum / time taken

FORCE WITH CHANGES OF DIRECTION:

- The greatest force or the resultant force determines which direction the object will travel to.


1.8 determine the distance travelled from the area between a velocity-time graph and the time axis.

CALCULATING THE DISTANCE TRAVELLED:

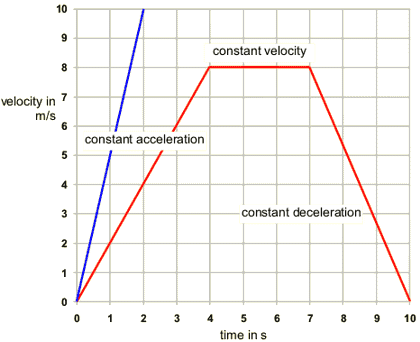
- We will use the red line on the picture for our calculations.

- Distance travelled can be calculated by the area underneath the graph.

- We need to work out the area of all the sections:

- For the first section the width is 4 s and the height is 8 m/s so using the equation Area of a triangle = 1/2 x base x height, we know that  the first section is 1/2 x 4 x 8 which is 16 m.
- For the second section the big rectangle has a width of 3 s (7-4) and a height of 8 m/s so using 3 x 8 = 24 m.
- The last section has a base of 3 s (10-7) and a height of 8 m/s so the are is 12 m.

- The final step is working out the area under the whole graph which is all the sections added together, 16 m + 24 m + 12 m = 58 m. This number is the total area under graph which represents the total distance covered.

1.7 determine acceleration from the gradient of a velocity-time graph

CALCULATING ACCELERATION FROM A VT GRAPH:

- We will use the red line on the picture for our calculations.

- To work out the first sections acceleration we need the equation, a = (v-u) / t.
- This tells us that from 0 m/s to 8 m/s there is a change of 8 m/s.
- The time covered in this interval is 4 seconds.
- So we divide 8 m/s by 4 s which gives us 2 m/s².
- Acceleration is measured in m/s².


1.6 plot and interpret velocity-time graphs

PLOTTING A VELOCITY-TIME GRAPH:

- On the X axis is the time in seconds and on the Y axis is velocity, which is measured in m/s.

INTERPRETING A VELOCITY-TIME GRAPH:

- On a VT graph, any area that is flat means that the object is moving at a steady speed.
- The steeper the gradient the greater the acceleration (Uphill /) or deceleration (Downhill \).
- The area underneath the graph is the distance travelled (click here to work that out).
- A curve means that the object is changing its acceleration.

1.5 know and use the relationship between acceleration, velocity and time

RELATIONSHIP BETWEEN ACCELERATION, VELOCITY AND TIME:

- To work out acceleration you simply divide change in velocity by the time taken.

         (v-u)
- a = -------
            t

1.4 describe experiments to investigate the motion of everyday objects such as toy cars or tennis balls

INVESTIGATING THE MOTION OF A TOY CAR ON A RAMP:

- 1) Set up your apparatus like the diagram.
- 2) Holding the car before the first light gate, mark a line on the ramp to find the starting position. This means that we can be sure it is a fair experiment since the car will start from the same point every time.
- 3) Next measure the distance between each light gate. This is crucial since we need this to work out its average speed.
- 4) We can now let go of the car from the start line. The light gates, being connected to a computer, will record the time on a software that allows you to data log.
- 5) Repeat this experiment a few times to obtain your average speed and repeating makes your experiment more reliable.
- 6) Now using the equation in 1.3 (click here) work out the average speed of the toy car going along the track.

1.3 know and use the relationship between average speed, distance moved and time: average speed = distance moved / time taken

RELATIONSHIP BETWEEN AV. SPEED, DIS. MOVED AND TIME:

- Simply as the title states, to work out the average speed, you divide the distance moved by the time taken.

Tuesday, 23 June 2015

1.2 plot and interpret distance-time graph

DISTANCE-TIME GRAPHS

- They show the distance covered over time.

- The steeper the line the faster/greater speed of the object.

- The green line shows that the object is moving at a steady speed.
- The blue is the object gaining speed/accelerating.
- The yellow is the object decelerating to the point where it is stationary.
- The red shows the object moving at a steady speed forward then stopping for 4 squares (could be seconds, minutes, etc. but is not stated.) then returning to its start position at a steady/constant speed.

Sunday, 21 June 2015

1.1 use the following units: kilogram (kg), metre (m), metre/second (m/s), metre/second2 (m/s2), newton (N), second (s), newton per kilogram (N/kg), kilogram metre/second (kg m/s).

UNITS:

- A kilogram can be written as kg. It is equal to 1000g.
- A metre can be written as m. It is equal to 100cm.
- A metre/second can be written as m/s. Used for speed.
- A metre/second^2 can be written as m/s^2. It is used for covering an area.
- A newton can be written as N. It is used for shortening kg.m/s^2.
- A second can be written as s. It is equal to 100ms or 1/60th of a minute.
- A newton/kg can be written as N/kg. It is used for weight when a force is applied to a weight.
- A kilogram.metre/second can be written as kg.m/s. It is used for momentum.